
Archivo: Zeta polar

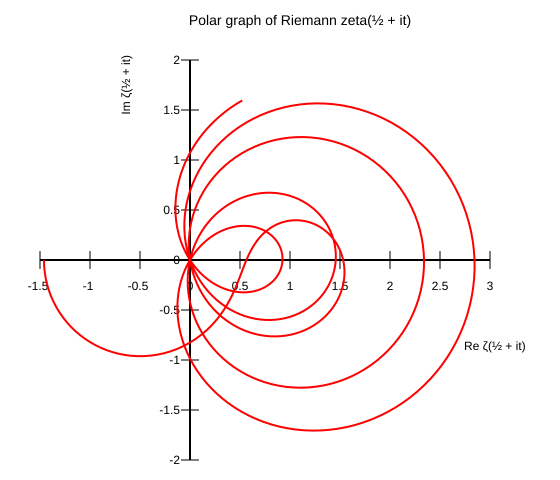
Descripción: This image shows the path of the Riemann zeta function along the critical line. That is, it is a graph of ℜζ(it+1/2){\displaystyle \Re \zeta (it+1/2)} versus ℑζ(it+1/2){\displaystyle \Im \zeta (it+1/2)} for real values of t running from 0 to 34. The first five zeros in the critical strip are clearly visible as the place where the spirals pass through the origin. The plotcurve is accurate to 6 digits.
Título: Zeta polar
Créditos: http://en.wikipedia.org/wiki/Image:Zeta_polar.svg
Autor(a): Original artwork created by Linas Vepstas <linas@linas.org> User:Linas 19 de febrero de 2006 New smooth and precise plotcurve version by User:Geek3 16 de diciembre de 2008
Términos de Uso: Creative Commons Attribution-Share Alike 3.0
Licencia: CC-BY-SA-3.0
Enlace de Licencia: http://creativecommons.org/licenses/by-sa/3.0/
¿Se exige la atribución?: Sí
Usos del archivo
Las siguientes páginas enlazan a este archivo:
