
Archivo: Global CO2 emissions and probabilistic temperature outcomes of Paris
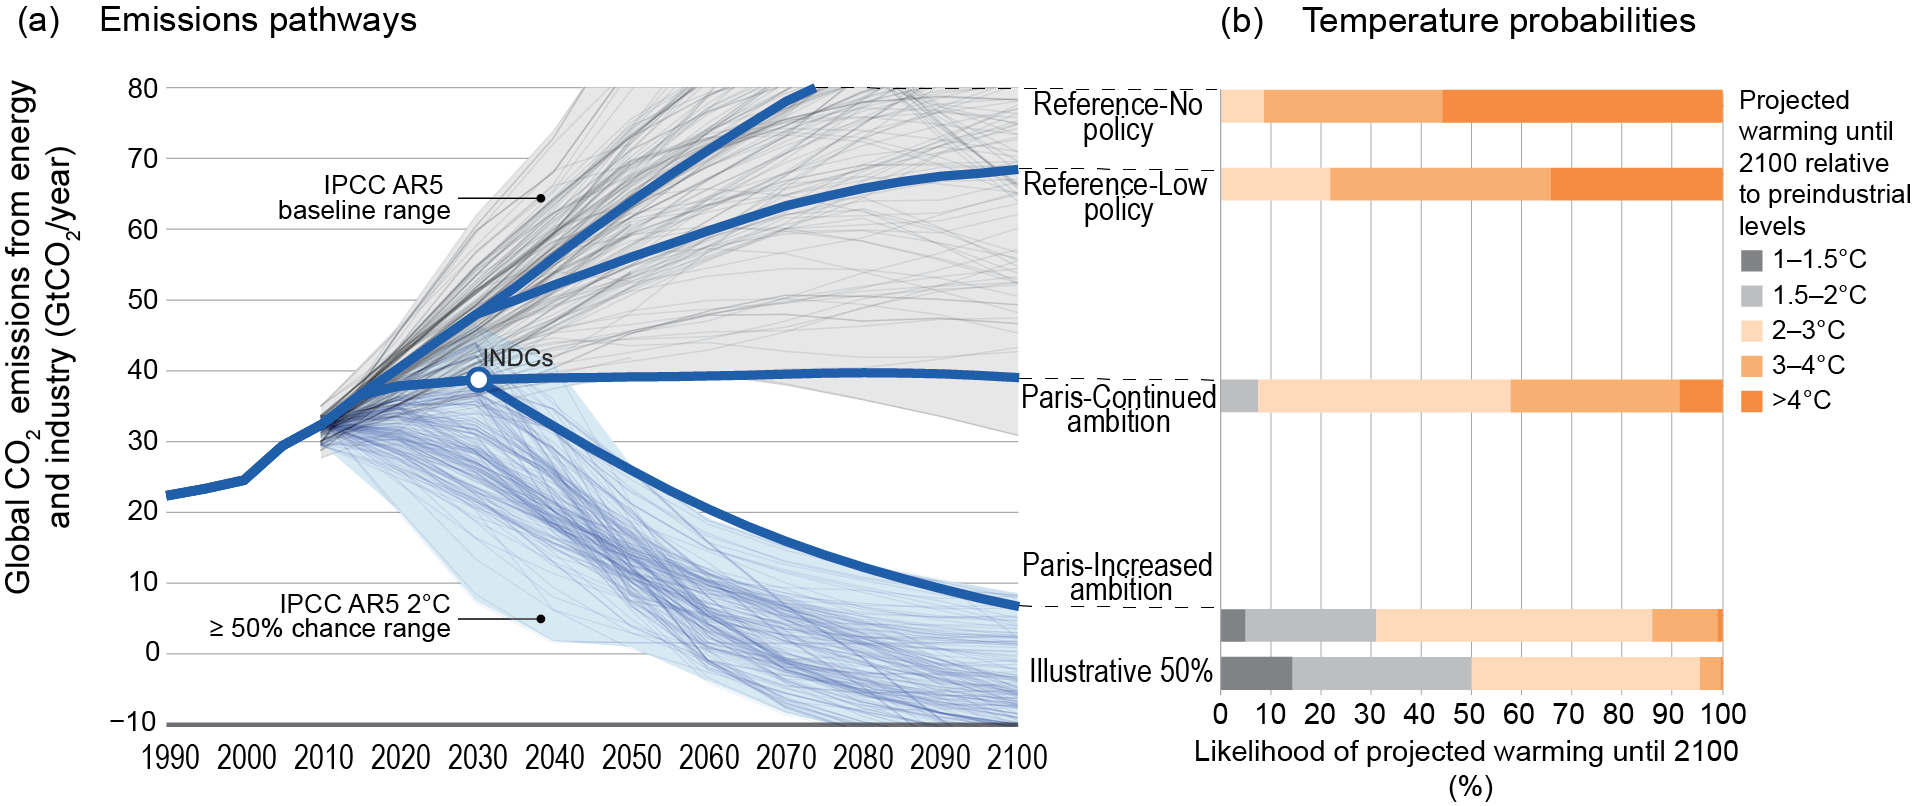
Description: Global CO2 emissions and probabilistic temperature outcomes of government announcements associated with the lead up to the Paris climate conference. (a) Global CO2 emissions from energy and industry (includes CO2 emissions from all fossil fuel production and use and industrial processes such as cement manufacture that also produce CO2 as a byproduct) for emissions pathways following no policy, current policy, meeting the governments’ announcements with constant country decarbonization rates past 2030, and meeting the governments’ announcements with higher rates of decarbonization past 2030. INDCs refer to Intended Nationally Determined Contributions which is the term used for the governments’ announced actions in the lead up to Paris. (b) Likelihoods of different levels of increase in global mean surface temperature during the 21st century relative to preindustrial levels for the four scenarios. Although (a) shows only CO2 emissions from energy and industry, temperature outcomes are based on the full suite of GHG, aerosol, and short-lived species emissions across the full set of human activities and physical Earth systems.
Title: Global CO2 emissions and probabilistic temperature outcomes of Paris
Credit: The source for the diagram given in the report is U.S. Global Change Research Program: Climate Science Special Report, Fourth National Climate Assessment (NCA4), Volume I, chapter 14.2. https://science2017.globalchange.gov/
Author: This panel, “Emission Pathways”, is an adapted figure provided by Jae Edmonds. The original figure is found in: A.A. Fawcett, G.C. Iyer, L.E. Clarke, J.A. Edmonds, N.E. Hultman, H.C. McJeon, J. Rogeli, R. Schuler, J. Alsalam, G.R. Asrar, J. Creason, M. Jeong, J. McFarland, A. Mundra, and W. Shi, 2015: Can Paris pledges avert severe climate change? Science, 350 6266,1168-1169. The figure version presented here was adapted from the original as follows: For panel #1; The faint lines representing the emissions trajectories were removed. For panel #2; The Illustrative 50% likelihood projection was removed from the bottom of the chart.
Usage Terms: Public domain
License: Public domain
Attribution Required?: No
Usos del archivo
Las siguientes páginas enlazan a este archivo:
