Anexo:Ciudades de Australia por población para niños
Esta lista te muestra las ciudades y pueblos más grandes de Australia, ordenados por la cantidad de personas que viven en ellos. Esta clasificación se basa en lo que la Oficina Australiana de Estadística llama "Áreas Urbanas Significativas" (SUA, por sus siglas en inglés).
Las SUA son zonas que representan ciudades o grupos de pueblos importantes. Para ser una SUA, un lugar debe tener al menos 10,000 habitantes. Estas áreas se usan para estudios y estadísticas, y no siempre coinciden con los límites oficiales de las ciudades.
Contenido
Las Ciudades Más Grandes de Australia por Población
Aquí puedes ver una lista de las "Áreas Urbanas Significativas", incluyendo las capitales de los estados y territorios, según los datos oficiales de la Oficina Australiana de Estadística hasta el 30 de junio de 2021. Las capitales están marcadas en negrita.
Es interesante saber que el 70% de la gente que vive en Australia reside en las ocho ciudades más pobladas del país.
| Puesto | Área urbana significativa | Estado/territorio | Población residente estimada | Crecimiento | |
|---|---|---|---|---|---|
| Junio de 2021 | Junio de 2016 | ||||
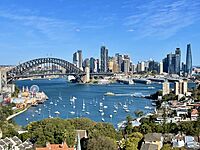
| 1 | Sídney | 4 959 107 | 4 637 436 | +6.94% | |
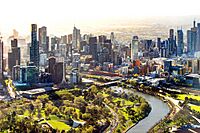
| 2 | Melbourne | 4 901 863 | 4 546 593 | +7.81% | |
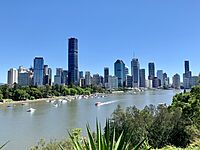
| 3 | Brisbane | 2 495 825 | 2 282 759 | +9.33% | |
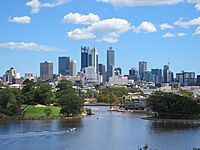
| 4 | Perth | 2 099 530 | 1 982 270 | +5.92% | |
| 5 | Adelaida | 1 359 087 | 1 305 526 | +4.10% | |
| 6 | Gold Coast–Tweed Heads | 718 772 | 645 711 | +11.31% | |
| 7 | Newcastle–Maitland | 505 489 | 475 716 | +6.26% | |
| 8 | Canberra–Queanbeyan | 462 984 | 439 971 | +5.23% | |
| 9 | Sunshine Coast | 353 906 | 316 905 | +11.68% | |
| 10 | Central Coast | 338 567 | 328 330 | +3.12% | |
| 11 | Wollongong | 312 167 | 294 784 | +5.90% | |
| 12 | Geelong | 287 704 | 254 296 | +13.14% | |
| 13 | Hobart | 218 386 | 207 396 | +5.30% | |
| 14 | Townsville | 184 271 | 178 244 | +3.38% | |
| 15 | Cairns | 155 529 | 149 182 | +4.25% | |
| 16 | Toowoomba | 140 303 | 133 654 | +4.97% | |
| 17 | Darwin | 132 921 | 133 098 | -0.13% | |
| 18 | Ballarat | 111 348 | 101 678 | +9.51% | |
| 19 | Bendigo | 103 575 | 95 934 | +7.96% | |
| 20 | Albury–Wodonga | 97 274 | 90 836 | +7.09% | |
| 21 | Launceston | 88 884 | 85 732 | +3.68% | |
| 22 | Mackay | 81 262 | 80 411 | +1.06% | |
| 23 | Rockhampton | 79 967 | 78 598 | +1.74% | |
| 24 | Melton | 77 392 | 61 960 | +24.91% | |
| 25 | Bunbury | 75 440 | 73 678 | +2.39% | |
| 26 | Coffs Harbour | 73 443 | 70 106 | +4.76% | |
| 27 | Bundaberg | 71 796 | 70 179 | +2.30% | |
| 28 | Wagga Wagga | 57 004 | 55 800 | +2.16% | |
| 29 | Hervey Bay | 56 599 | 53 016 | +6.76% | |
| 30 | Shepparton–Mooroopna | 52 273 | 50 708 | +3.09% | |
| 31 | Mildura–Wentworth | 51 794 | 51 051 | +1.46% | |
| 32 | Port Macquarie | 50 365 | 46 376 | +8.60% | |
| 33 | Gladstone–Tannum Sands | 45 987 | 44 954 | +2.30% | |
| 34 | Tamworth | 43 330 | 41 986 | +3.20% | |
| 35 | Traralgon–Morwell | 42 567 | 41 385 | +2.86% | |
| 36 | Warragul–Drouin | 42 115 | 35 523 | +18.56% | |
| 37 | Bowral–Mittagong | 41 454 | 38 653 | +7.25% | |
| 38 | Orange | 41 162 | 39 586 | +3.98% | |
| 39 | Busselton | 41 034 | 37 690 | +8.87% | |
| 40 | Dubbo | 39 363 | 37 118 | +6.05% | |
| 41 | Nowra–Bomaderry | 38 947 | 36 790 | +5.86% | |
| 42 | Bathurst | 38 087 | 35 878 | +6.16% | |
| 43 | Geraldton | 37 228 | 38 369 | -2.97% | |
| 44 | Warrnambool | 35 957 | 34 615 | +3.88% | |
| 45 | Albany | 34 612 | 33 784 | +2.45% | |
| 46 | Devonport | 30 883 | 29 900 | +3.29% | |
| 47 | Mount Gambier | 29 940 | 29 532 | +1.38% | |
| 48 | Nelson Bay | 28 752 | 27 459 | +4.71% | |
| 49 | Kalgoorlie–Boulder | 28 565 | 30 652 | −6.81% | |
| 50 | Lismore | 28 469 | 29 016 | -1.89% | |
| 51 | Victor Harbor–Goolwa | 28 059 | 26 154 | +7.28% | |
| 52 | Maryborough | 27 583 | 27 240 | +1.26% | |
| 53 | Burnie–Wynyard | 27 519 | 26 978 | +2.01% | |
| 54 | Ballina | 27 380 | 25 643 | +6.77% | |
| 55 | Morisset–Cooranbong | 26 868 | 24 207 | +10.99% | |
| 56 | Alice Springs | 26 476 | 26 518 | -0.16% | |
| 57 | Taree | 26 343 | 26 385 | -0.16% | |
| 58 | Goulburn | 24 464 | 23 415 | +4.48% | |
| 59 | Bacchus Marsh | 24 443 | 20 989 | +16.46% | |
| 60 | Armidale | 24 194 | 24 114 | +0.33% | |
| 61 | Gisborne–Macedon | 22 681 | 21 011 | +7.95% | |
| 62 | Gympie | 22 068 | 21 315 | +3.53% | |
| 63 | Echuca–Moama | 21 994 | 20 848 | +5.50% | |
| 64 | Whyalla | 21 230 | 22 432 | −5.36% | |
| 65 | Forster–Tuncurry | 21 042 | 20 855 | +0.90% | |
| 66 | Griffith | 20 599 | 19 709 | +4.52% | |
| 67 | St Georges Basin–Sanctuary Point | 20 213 | 18 545 | +8.99% | |
| 68 | Yeppoon | 19 870 | 18 539 | +7.18% | |
| 69 | Wangaratta | 19 558 | 18 940 | +3.26% | |
| 70 | Murray Bridge | 19 484 | 18 196 | +7.08% | |
| 71 | Grafton | 19 037 | 18 359 | -0.35% | |
| 72 | Camden Haven | 18 942 | 17 001 | +11.42% | |
| 73 | Mount Isa | 18 080 | 19 271 | −6.18% | |
| 74 | Karratha | 17 558 | 16 363 | +7.30% | |
| 75 | Broken Hill | 17 230 | 18 114 | −4.88% | |
| 76 | Ulladulla | 17 199 | 15 618 | +10.12% | |
| 77 | Batemans Bay | 16 891 | 16 381 | +3.11% | |
| 78 | Moe–Newborough | 16 841 | 16 840 | +0.01% | |
| 79 | Horsham | 16 705 | 16 462 | +1.48% | |
| 80 | Port Lincoln | 16 529 | 16 198 | +2.04% | |
| 81 | Singleton | 16 147 | 16 517 | -2.24% | |
| 82 | Yanchep | 15 742 | 12 169 | +29.36% | |
| 83 | Bairnsdale | 15 705 | 14 899 | +5.41% | |
| 84 | Kempsey | 15 463 | 15 125 | +2.23% | |
| 85 | Sale | 15 388 | 14 891 | +3.34% | |
| 86 | Warwick | 15 223 | 15 395 | -1.12% | |
| 87 | Port Hedland | 15 050 | 14 411 | +4.43% | |
| 88 | Ulverstone | 14 613 | 14 402 | +1.47% | |
| 89 | Emerald | 14 489 | 13 867 | +4.49% | |
| 90 | Broome | 14 333 | 14 535 | -1.39% | |
| 91 | Port Pirie | 13 990 | 14 347 | -2.49% | |
| 92 | Port Augusta | 13 239 | 14 053 | -5.79% | |
| 93 | Lithgow | 12 756 | 13 040 | -2.18% | |
| 94 | Mudgee | 12 666 | 12 019 | +5.38% | |
| 95 | Colac | 12 474 | 12 450 | +0.19% | |
| 96 | Muswellbrook | 12 210 | 12 376 | -1.34% | |
| 97 | Esperance | 12 036 | 12 355 | -2.58% | |
| 98 | Parkes | 11 106 | 11 251 | -1.29% | |
| 99 | Swan Hill | 10 899 | 11 079 | -1.62% | |
| 100 | Portland | 10 832 | 10 943 | +1.01% | |
| 101 | Kingaroy | 10 286 | 10 464 | -1.70% | |
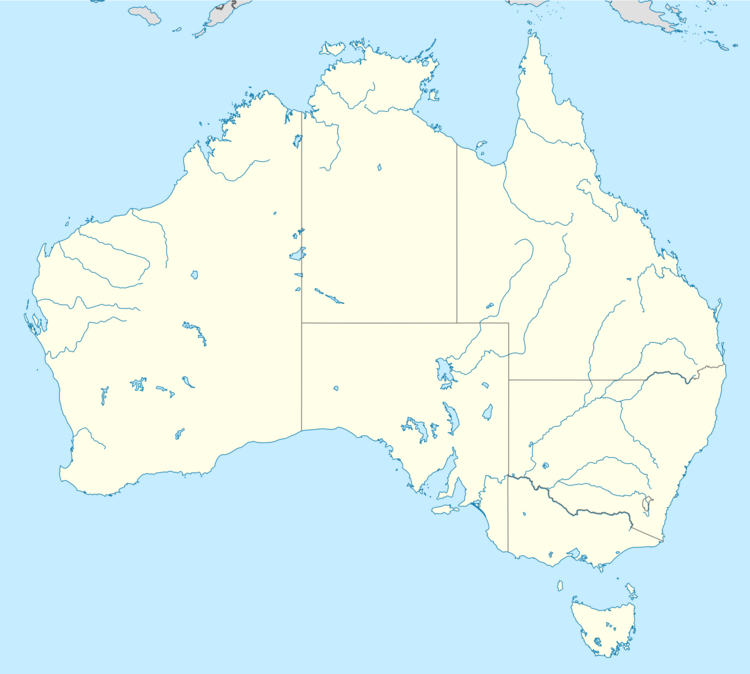
Mapa de las 20 Áreas Urbanas Más Grandes
Coast
Para Saber Más
- Demografía de Australia
- Anexo:Ciudades de Australia
Véase también
 En inglés: List of cities in Australia by population Facts for Kids


