
Archivo: Wiggers Diagram

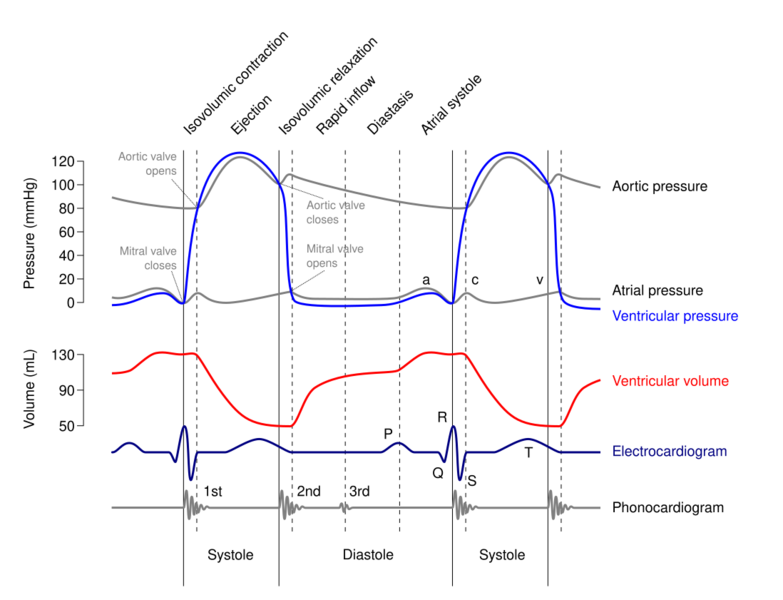
Descripción: A Wiggers diagram, showing the cardiac cycle events occuring in the left ventricle. In the atrial pressure plot: wave "a" corresponds to atrial contraction, wave "c" corresponds to an increase in pressure from the mitral valve bulging into the atrium after closure, and wave "v" corresponds to passive atrial filling. In the electrocardiogram: wave "P" corresponds to atrial depolarization, waves "QRS" correspond to ventricular depolarization, and wave "T" corresponds to ventricular repolarization. In the phonocardiogram: The sound labeled 1st contributes to the S1 heart sound and is the reverberation of blood from the sudden closure of the mitral valve (left A-V valve) and the sound labeled "2nd" contributes to the S2 heart sound and is the reverberation of blood from the sudden closure of the aortic valve.
Título: Wiggers Diagram
Créditos: Wikimedia Commons, File:Wiggers Diagram.png.
Autor(a): DanielChangMD revised original work of DestinyQx; Redrawn as SVG by xavax
Términos de Uso: Creative Commons Attribution-Share Alike 2.5
Licencia: CC BY-SA 2.5
Enlace de Licencia: https://creativecommons.org/licenses/by-sa/2.5
¿Se exige la atribución?: Sí
Usos del archivo
La siguiente página enlaza a este archivo:
