
Archivo: Variance visualisation

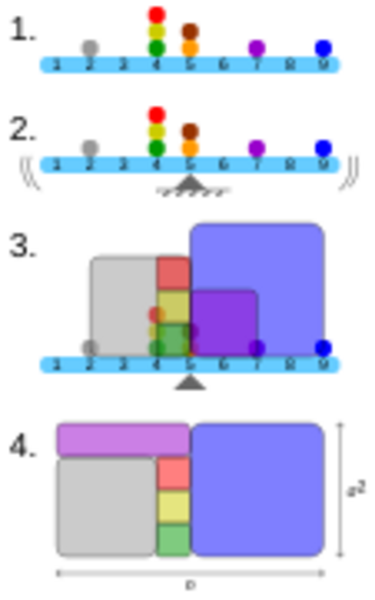
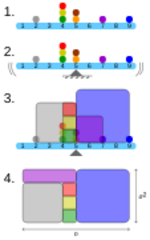
Descripción: Geometric visualisation of the variance of the example distribution (2, 4, 4, 4, 5, 5, 7, 9) on w:Standard deviation. 1. A frequency distribution is constructed. 2. The centroid of the distribution gives its mean. 3. A square with sides equal to the difference of each value from the mean is formed for each value. 4. Arranging the squares into a rectangle with one side equal to the number of values (n) results in the other side being equal to the variance of the distribution (σ²).
Título: Variance visualisation
Créditos: Trabajo propio
Autor(a): Cmglee
Términos de Uso: Creative Commons Attribution-Share Alike 3.0
Licencia: CC BY-SA 3.0
Enlace de Licencia: https://creativecommons.org/licenses/by-sa/3.0
¿Se exige la atribución?: Sí
Usos del archivo
La siguiente página enlaza a este archivo:
