
Archivo: SAT-ACT-Preference-Map-2006

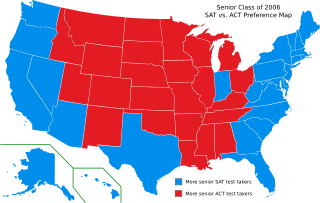
Descripción: This map of the United States shows the states in which (blue color) more seniors took the SAT than the ACT, and the states in which (red color) more seniors took the ACT than the SAT. The blue and red colors were selected to match the logos of the College Board and ACT, Inc., respectively. Data is for the senior class of 2006. Sources: College Board 2006 State Profile Reports; ACT, Inc. 2006 State Profile Reports.
Título: SAT-ACT-Preference-Map-2006
Créditos: Trabajo propio. This file is a modified version of the public domain file SAT-ACT Preference Map.
Autor(a): Erik Jacobsen ( erikthered.com )
Términos de Uso: Creative Commons Zero, Public Domain Dedication
Licencia: CC0
Enlace de Licencia: http://creativecommons.org/publicdomain/zero/1.0/deed.en
¿Se exige la atribución?: No
Usos del archivo
La siguiente página enlaza a este archivo:
