
Archivo: Opinion polling for the Dutch general election, 2017
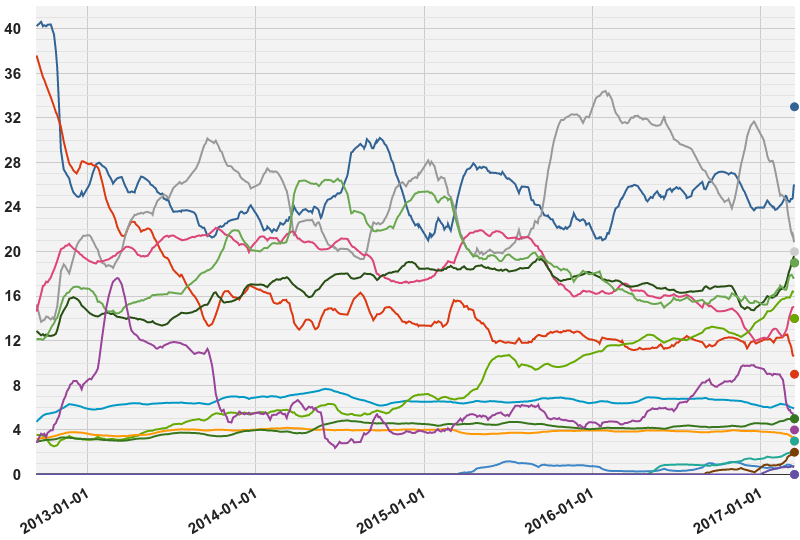
Description: The seat projections in the graph are continuous from September 2012 (the last general election) up to the current date. Each colored line specifies a political party; numbers on the y-axis represent numbers of seats. These seat estimates are based off of data from Peilingwijzer, which is not strictly a polling average but a model using polls conducted by I&O Research, Ipsos, TNS NIPO, LISS panel, Peil, and De Stemming to calculate the trajectory of party support. VVD PvdA PVV SP CDA D66 CU GL SGP PvdD 50+ VNL DENK FvD PPNL
Title: Opinion polling for the Dutch general election, 2017
Credit: Peilingwijzer, Tom Louwerse, Universiteit Leiden
Author: Mélencron
Usage Terms: Creative Commons Attribution-Share Alike 4.0
License: CC BY-SA 4.0
License Link: https://creativecommons.org/licenses/by-sa/4.0
Attribution Required?: Yes
Usos del archivo
La siguiente página enlaza a este archivo:
