
Archivo: Instrumental Temperature Record (NASA)

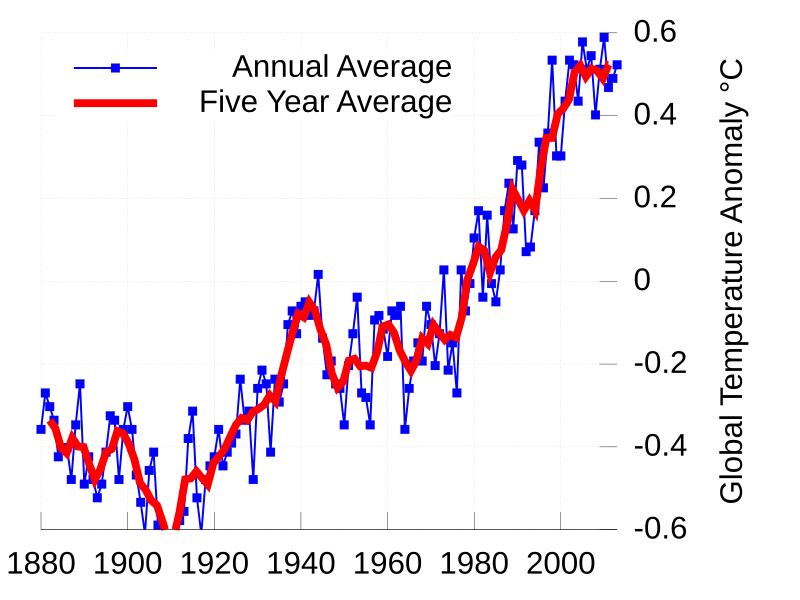
Description: This image shows the instrumental record of global average w:temperatures as compiled by the w:NASA's w:Goddard Institute for Space Studies. The data set used follows the methodology outlined by Hansen, J., et al. (2006) "Global temperature change". Proc. Natl. Acad. Sci. 103: 14288-14293. Following the common practice of the IPCC, the zero on this figure is the mean temperature from 1961-1990. The graph shows an overall long-term warming trend. In the 1880s, the global temperature anomaly was on average slightly below -0.4 °C, while in the first decade of the 21st century, the anomaly was on average almost +0.5 °C. This figure was originally prepared by Robert A. Rohde from publicly available data and is incorporated into the Global Warming Art project.
Title: Instrumental Temperature Record (NASA)
Credit: Instrumental Temperature Record.png
Author: Instrumental Temperature Record.png: NASA derivative work: Autopilot (talk)
Usage Terms: Creative Commons Attribution-Share Alike 3.0
License: CC-BY-SA-3.0
License Link: http://creativecommons.org/licenses/by-sa/3.0/
Attribution Required?: Yes
Usos del archivo
La siguiente página enlaza a este archivo:
.svg&oldid=818583)

.svg)