
Archivo: Hagupit 2014 track

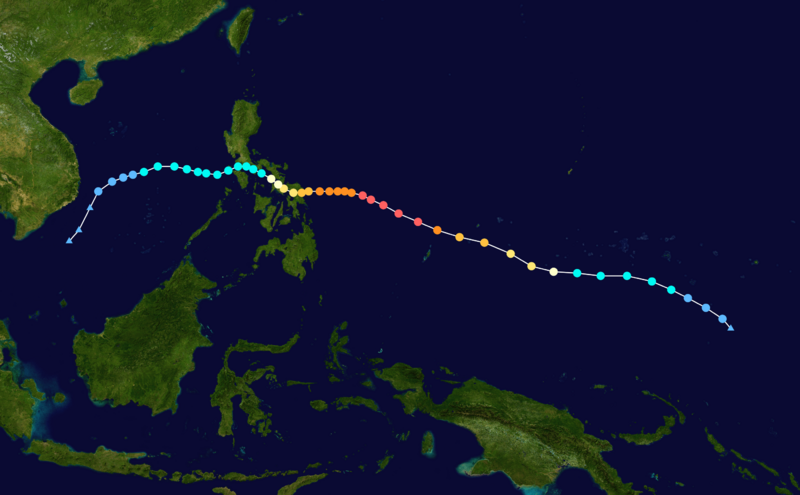
Descripción: Track map of Typhoon Hagupit of the 2014 Pacific typhoon season. The points show the location of the storm at 6-hour intervals. The colour represents the storm's maximum sustained wind speeds as classified in the Saffir–Simpson scale (see below), and the shape of the data points represent the nature of the storm, according to the legend below. Saffir–Simpson scale .mw-parser-output .div-col{margin-top:.3em;column-width:30em}.mw-parser-output .div-col-small{font-size:90%}.mw-parser-output .div-col-rules{column-rule:thin solid #AAA}.mw-parser-output .div-col dl,.mw-parser-output .div-col ol,.mw-parser-output .div-col ul{margin-top:0}.mw-parser-output .div-col li,.mw-parser-output .div-col dd{page-break-inside:avoid;break-inside:avoid-column} Tropical depression (≤38 mph, ≤62 km/h) Tropical storm (39–73 mph, 63–118 km/h) Category 1 (74–95 mph, 119–153 km/h) Category 2 (96–110 mph, 154–177 km/h) Category 3 (111–129 mph, 178–208 km/h) Category 4 (130–156 mph, 209–251 km/h) Category 5 (≥157 mph, ≥252 km/h) Unknown Storm type Tropical cyclone Subtropical cyclone Extratropical cyclone / Remnant low / Tropical disturbance / Monsoon depression
Título: Hagupit 2014 track
Créditos: Created by Meow using WikiProject Tropical cyclones/Tracks. The background image is from NASA. Tracking data is from the Joint Typhoon Warning Center[1].
Autor(a): Meow
Términos de Uso: Dominio Público
Licencia: Dominio Público
¿Se exige la atribución?: No
Usos del archivo
Las siguientes páginas enlazan a este archivo:
