
Archivo: Changes in total solar irradiance and monthly sunspot numbers, 1975-2013-es
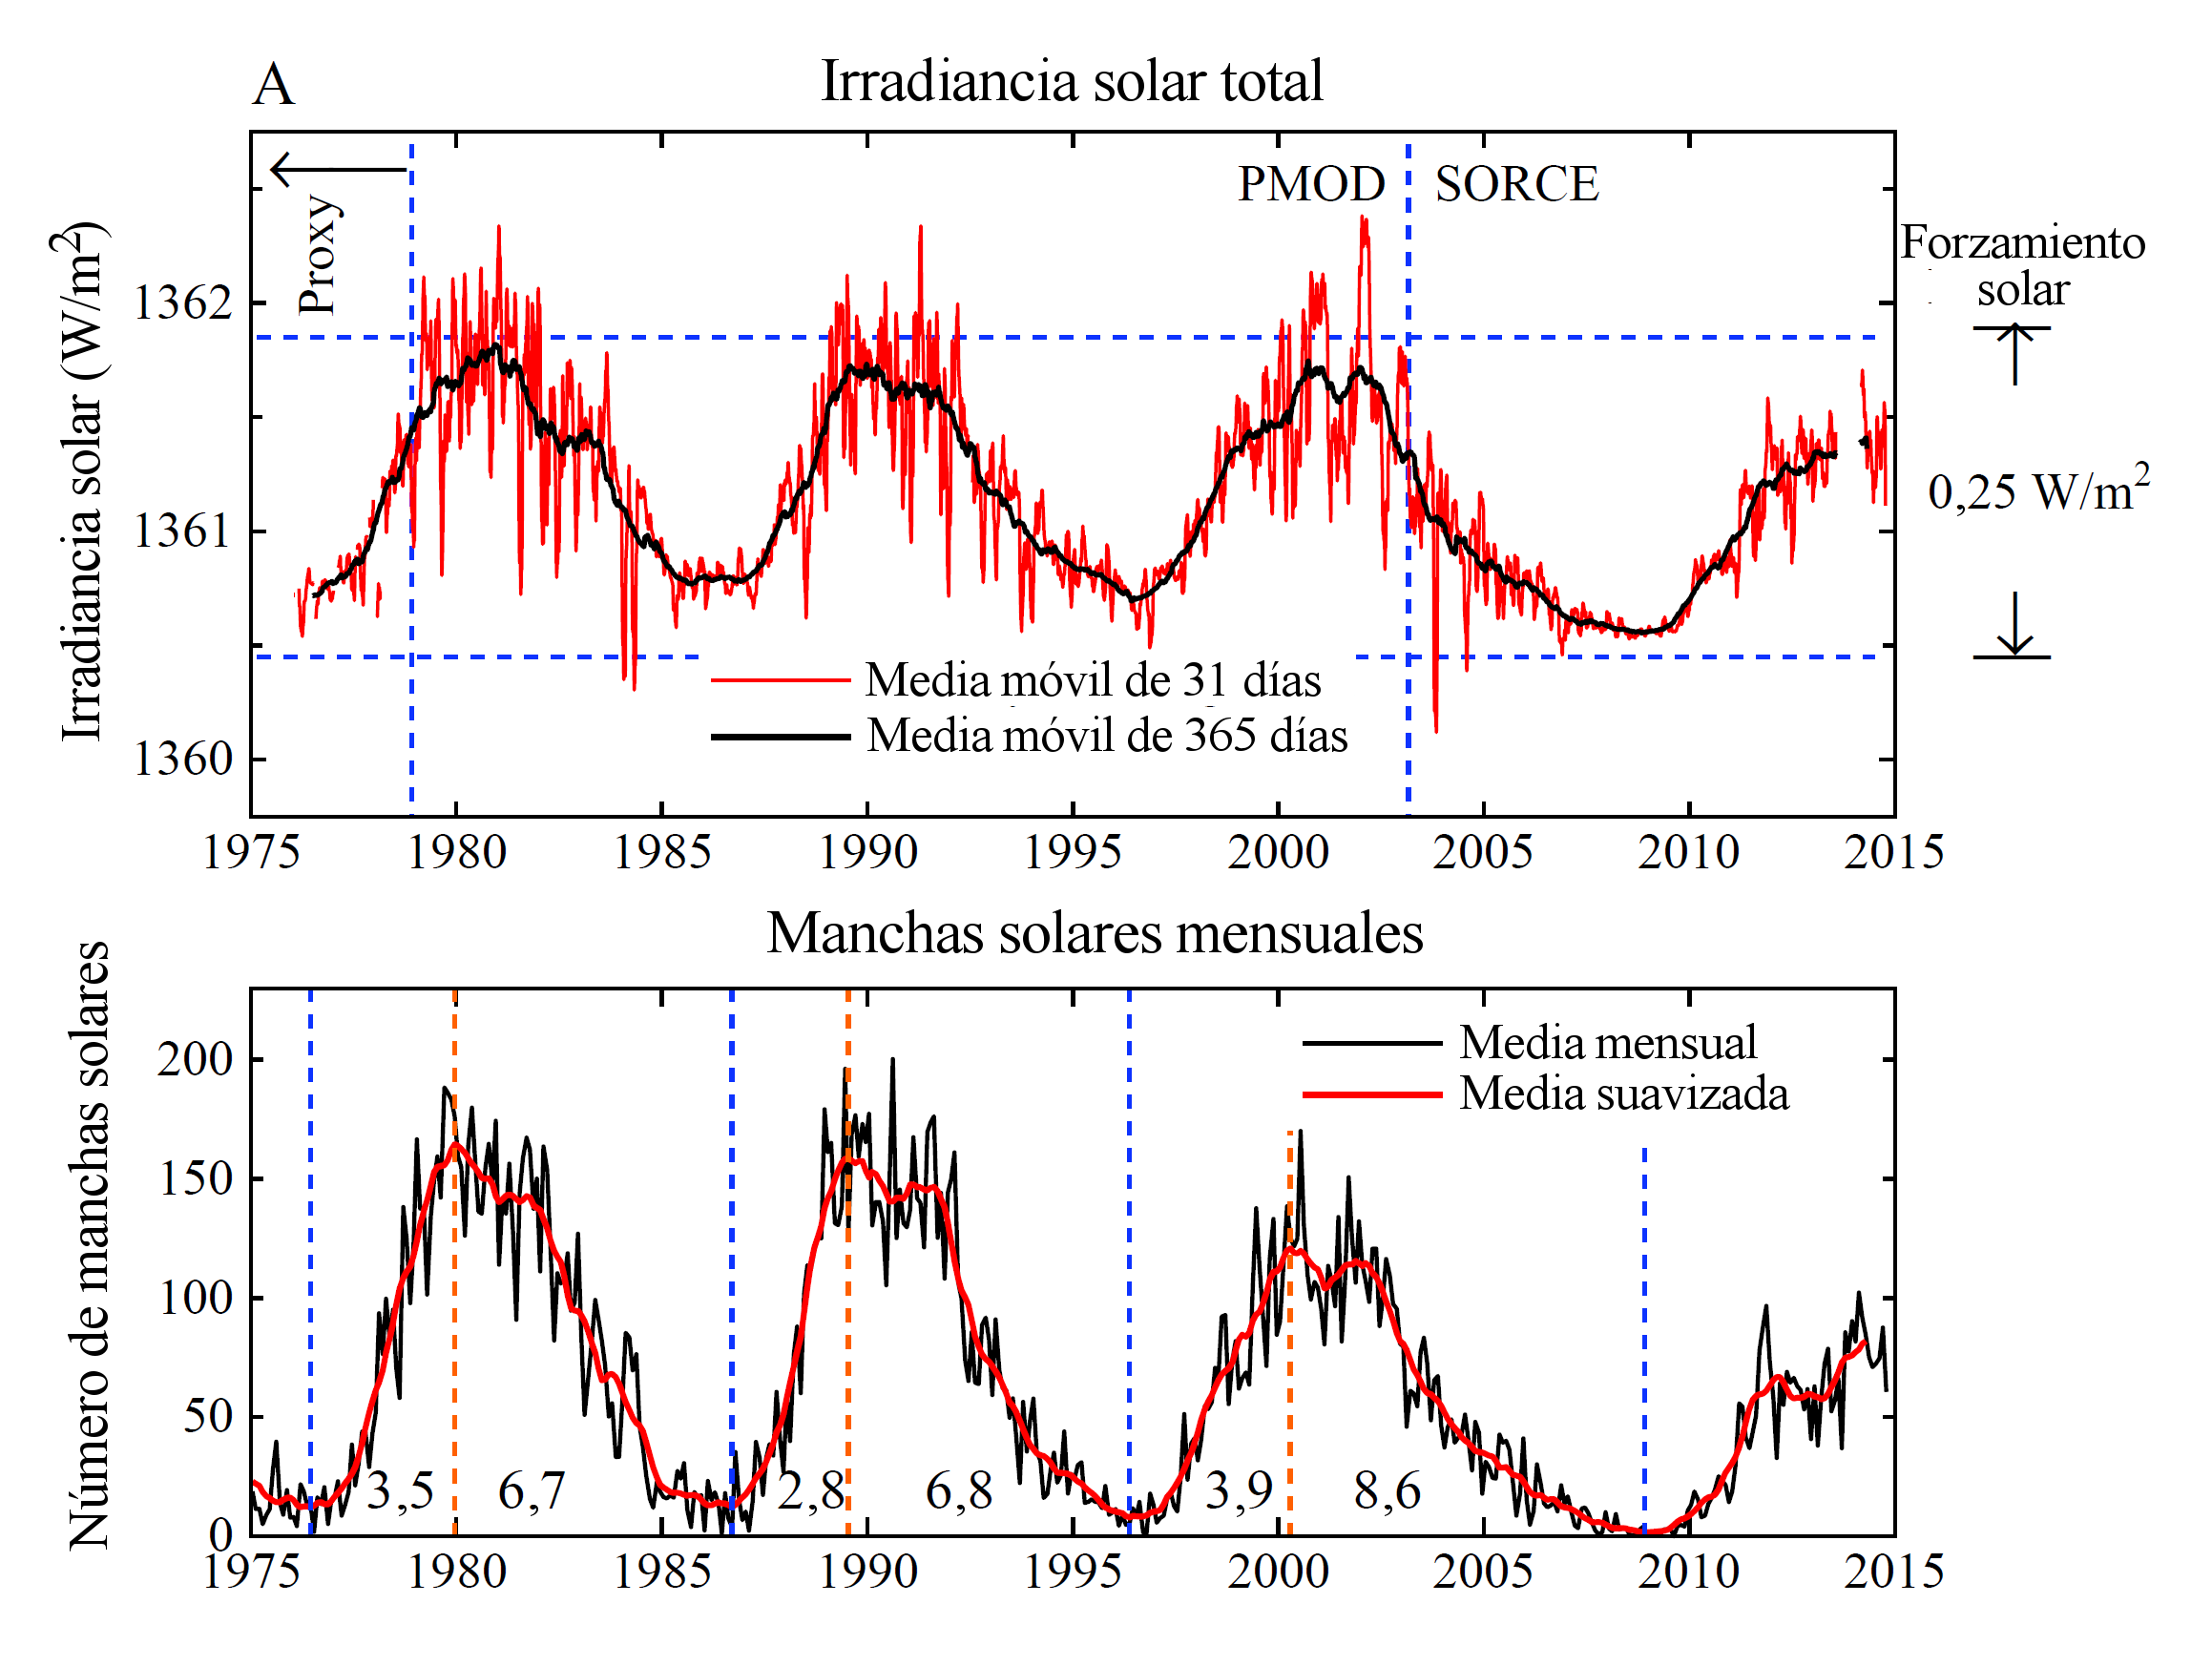
Descripción: Version in Spanish. two graphs show changes in total solar irradiance (TSI, labelled "A") and monthly sunspot numbers ("B") between approximately 1975 to 2013.
Título: Changes in total solar irradiance and monthly sunspot numbers, 1975-2013-es
Créditos: Open access: Figure 7, in: Hansen, J., et al. (2013), "Assessing “Dangerous Climate Change”: Required Reduction of Carbon Emissions to Protect Young People, Future Generations and Nature", PLoS ONE 8 (12), http://www.plosone.org/article/info%3Adoi%2F10.1371%2Fjournal.pone.0081648. Archived 14 August 2014. A high-resolution version of this image is available here (archived 16 July 2014).
Autor(a): Hansen J, Kharecha P, Sato M, Masson-Delmotte V, Ackerman F, et al.
Términos de Uso: Creative Commons Zero, Public Domain Dedication
Licencia: CC0
Enlace de Licencia: http://creativecommons.org/publicdomain/zero/1.0/deed.en
¿Se exige la atribución?: No
Usos del archivo
La siguiente página enlaza a este archivo:
