
Archivo: Change in Average Temperature
Tamaño de esta previsualización PNG del archivo SVG: 705 × 599 píxeles. Otra resolución: 282 × 240 píxeles.
Archivo original (archivo SVG, nominalmente 960 × 816 píxeles, tamaño de archivo: 544 KB)
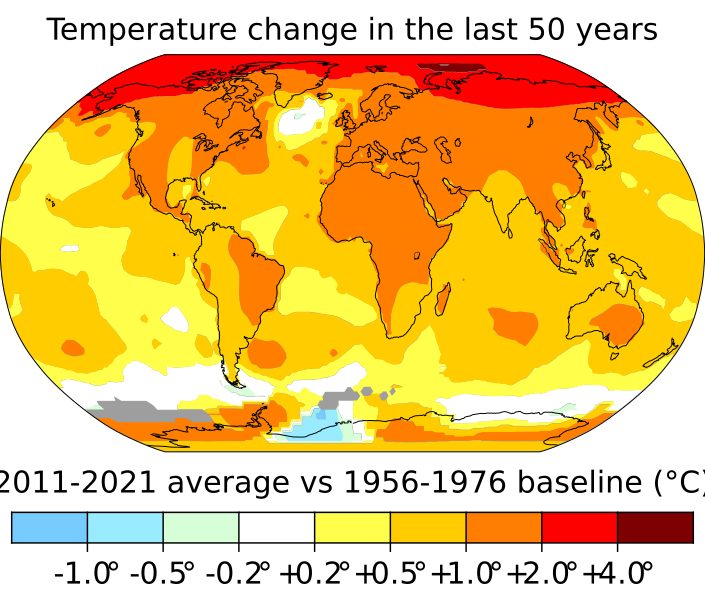
Description: Temperature changes to date have been most pronounced in northern latitudes and over land masses. The image uses longer term averages of at least a decade to smooth out climate variability due to factors such as El Niño. The map is improved from the highest quality rendering that NASA’s Scientific Visualization Studio generates, with horizontal and vertical lines removed and with a more legible projection of Kavraiskiy VII. Grey areas in the image have insufficient data for rendering.
Usage Terms: Public domain
Usos del archivo
Las siguientes páginas enlazan a este archivo:

Todo el contenido de los artículos de la Enciclopedia Kiddle (incluidas las imágenes) se puede utilizar libremente para fines personales y educativos bajo la licencia Atribución-CompartirIgual a menos que se indique lo contrario.