
Archivo: Aquarius spacecraft first global salinity map Aug-Sep 2011

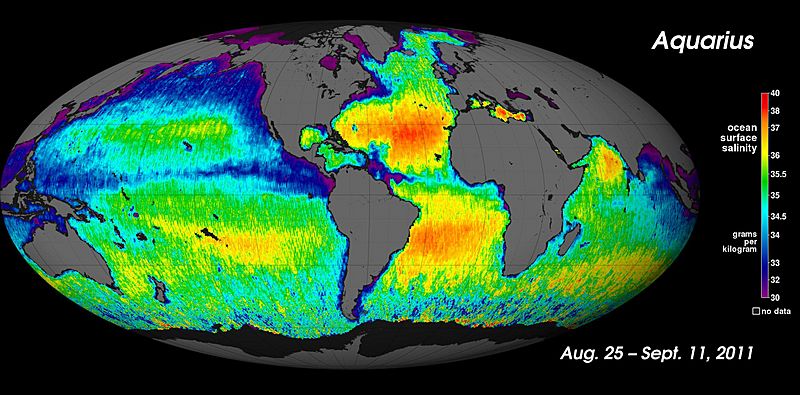
Descripción: NASA's "Salt of the Earth" Aquarius Reveals First Map. NASA's new Aquarius instrument has produced its first global map of the salinity, or saltiness, of Earth's ocean surface, providing an early glimpse of the mission's anticipated discoveries. Its rich tapestry of global salinity patterns demonstrates Aquarius' ability to resolve large-scale salinity distribution features clearly and with sharp contrast. The map provides a much better picture of ocean surface salinity than the Aquarius science team expected to have this early in the mission. The new map is a composite of the first two and a half weeks of data since Aquarius became operational on August 25. The numerical values represent salt concentration in parts per thousand (grams of salt per kilogram of sea water). Yellow and red colors represent areas of higher salinity, with blues and purples indicating areas of lower salinity. Areas colored black are gaps in the data. The average salinity on the map is about 35. The map reveals predominantly well-known ocean salinity features, such as higher salinity in the subtropics, higher average salinity in the Atlantic Ocean compared to the Pacific and Indian Oceans, and lower salinity in rainy belts near the equator, in the northernmost Pacific Ocean and elsewhere. These features are related to large-scale patterns of rainfall and evaporation over the ocean, river outflow and ocean circulation. Aquarius will monitor how these features change over time and study their link to climate and weather variations. Other important regional features are clearly evident, including a sharp contrast between the arid, high-salinity Arabian Sea west of the Indian subcontinent, and the low-salinity Bay of Bengal to the east, which is dominated by the Ganges River and south Asia monsoon rains. The data also show important smaller details, such as a larger-than-expected extent of low-salinity water associated with outflow from the Amazon River. To produce the map, Aquarius scientists performed a preliminary calibration of the early data gathered by comparing them with ocean surface salinity reference data. These early data contain some uncertainties, and months of additional calibration and data validation work remain. For example, measurements in the southernmost ocean regions are not yet reliable as they have large uncertainties associated with high winds and low surface temperatures. The north-south striped patterns visible throughout the image are artifacts of small residual calibration errors and are not real. In addition, low salinity values immediately adjacent to land and ice-covered areas are due to proximity to coastlines or ice edges, which introduces errors into the data that will require additional analyses to correct. Aquarius is making NASA's first space observations of ocean surface salinity variations, a key component of Earth's climate that is linked to the cycling of freshwater around our planet and that influences ocean circulation. The Aquarius/SAC-D (Satélite de Aplicaciones Científicas) observatory is a collaboration between NASA and Argentina's space agency, Comisión Nacional de Actividades Espaciales (CONAE). The mission launched June 10, 2011, from California's Vandenberg Air Force Base. Aquarius was built by NASA's Jet Propulsion Laboratory in Pasadena, Calif., and the Goddard Space Flight Center in Greenbelt, Md. NASA's Launch Services Program, at Kennedy Space Center in Florida, managed the launch. JPL is managing Aquarius through its commissioning phase and will archive mission data. Goddard will manage Aquarius mission operations and process science data. CONAE is providing the SAC-D spacecraft, an optical camera, a thermal camera with Canada, a microwave radiometer, other sensors and the mission operations center. France and Italy also are contributing instruments. For more information about Aquarius/SAC-D, visit http://www.nasa.gov/aquarius and http://www.conae.gov.ar/eng/principal.html.
Título: Aquarius spacecraft first global salinity map Aug-Sep 2011
Créditos: http://www.nasa.gov/mission_pages/aquarius/multimedia/gallery/pia14786.html file
Autor(a): NASA/GSFC/JPL-Caltech
Permiso: Public domainPublic domainfalsefalse Este archivo es de dominio público porque fue creado por la NASA. Las políticas sobre copyright de la NASA estipulan que «el material de la NASA no está protegido con copyright a menos que se indique lo contrario». (Políticas sobre copyright de la NASA o Políticas sobre la utilización de imágenes del Jet Propulsion Laboratory). Advertencias: El uso del logotipo de la NASA (incluidos el logotipo actual y los anteriores) está restringido. El sitio web de la NASA almacena una gran cantidad de imágenes del Programa Espacial de la URSS, de la Agencia Espacial Federal Rusa y otras agencias espaciales no estadounidenses. Estas imágenes no son de dominio público. Material del Telescopio espacial Hubble puede tener copyright si no proviene explícitamente del Space Telescope Science Institute. [1] Todo el material creado por la sonda espacial SOHO está protegido por copyright y requiere permiso para ser utilizado con fines comerciales o no educativos. [2] Las imágenes que figuran en el sitio web Astronomy Picture of the Day (APOD) pueden tener copyright. [3]
Términos del Uso: Public domain
Licencia: Public domain
¿Se exige la atribución?: No
Usos del archivo
La siguiente página enlaza a este archivo:
