
Archivo: 2019-20 European windstorm season summary map
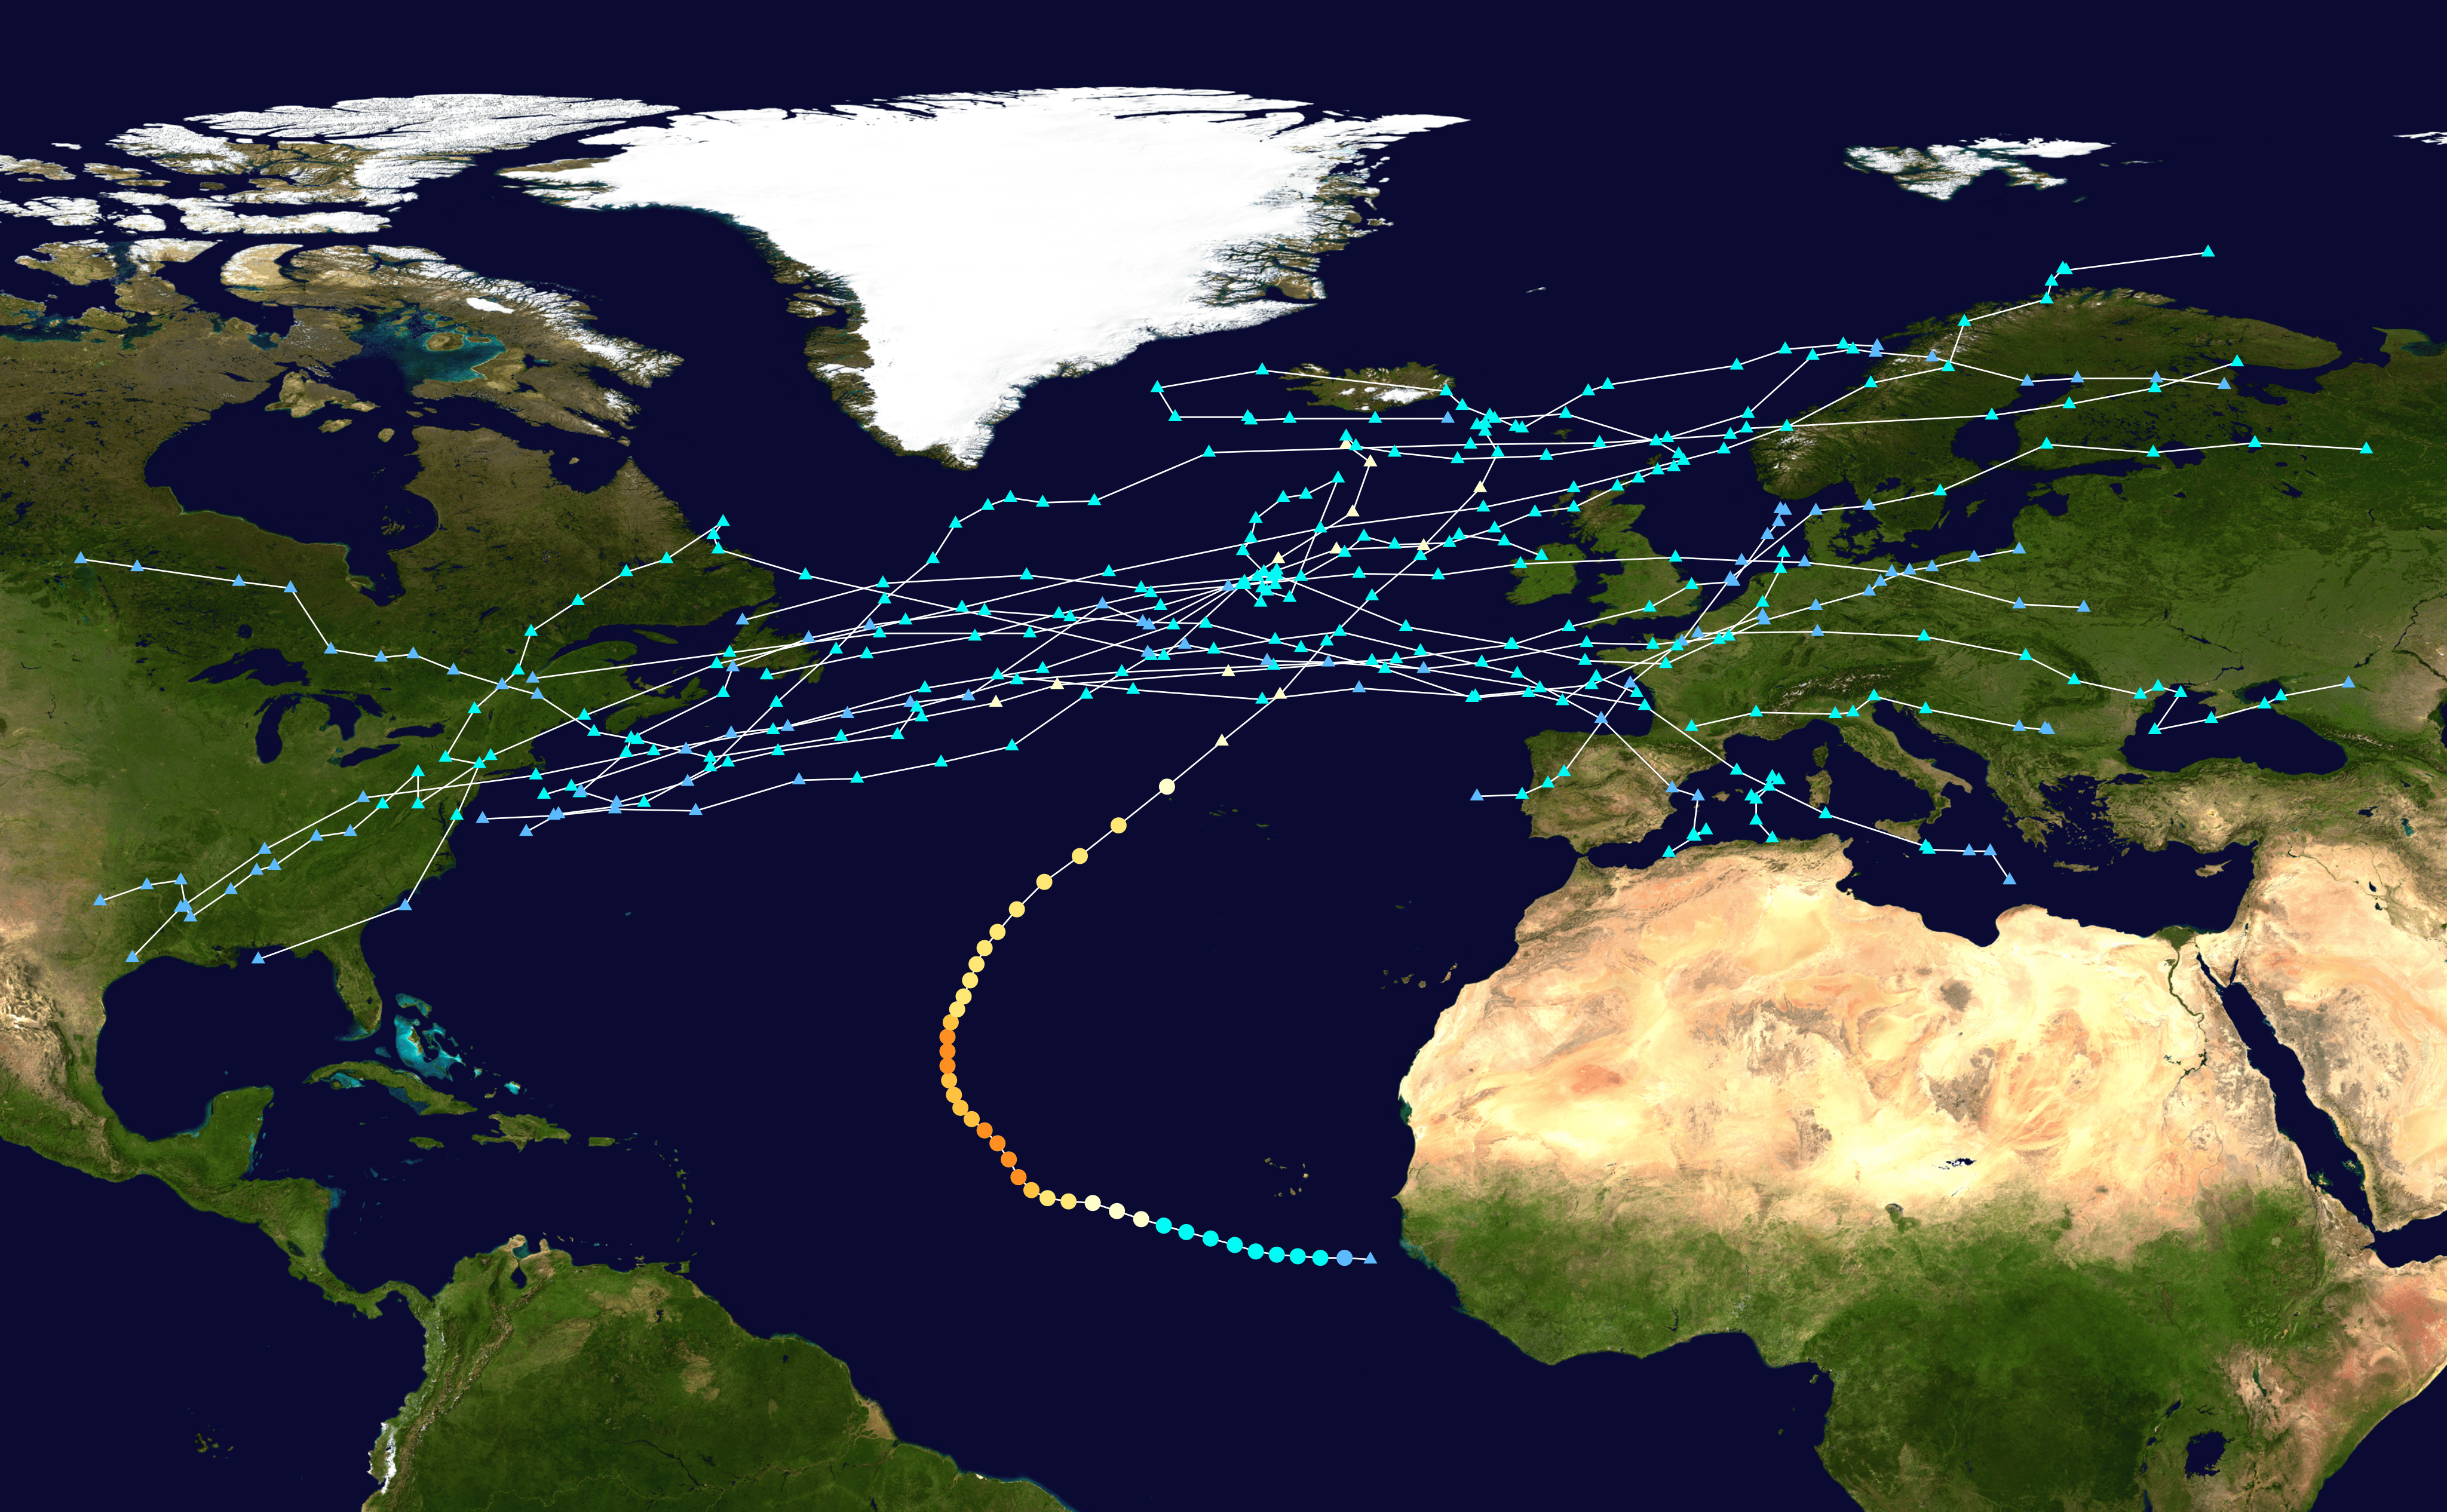
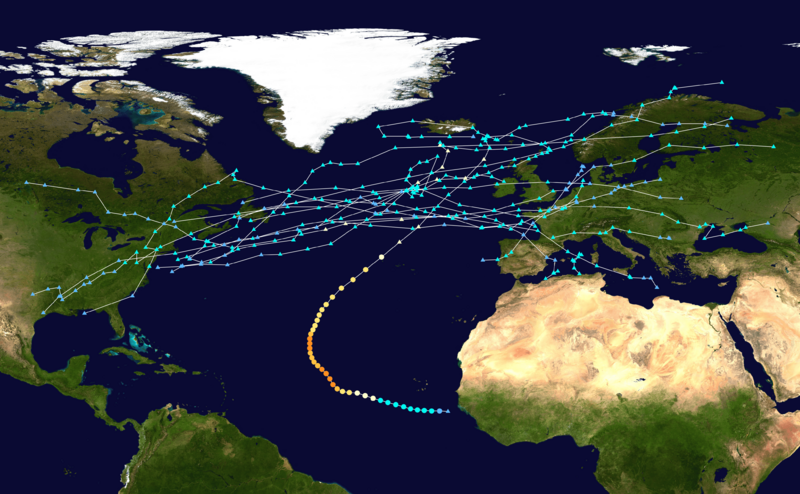
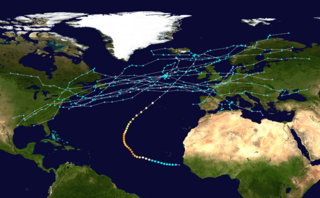
Descripción: Map of European windstorms of the 2019-20 European windstorm season. The points show the location of the lowest pressure of each storm at 6-hour intervals. The colour represents the storm's maximum sustained wind speeds as classified in the Saffir-Simpson Hurricane Scale (see below), and the shape of the data points represent the type of the storm. To recreate, use the following parameters: --extra 1 --dots 0.5 --lines 0.1 --res 4096. For input data, see below.
Título: 2019-20 European windstorm season summary map
Créditos: Created using WikiProject Tropical cyclones/Tracks. The background image is from NASA [1]. The tracking data is from the National Hurricane Center's Atlantic hurricane database, the Ocean Prediction Center's analysis maps and Met Office's analysis charts archived by wetter3.de. Wind speeds are from Ventusky using GFS.
Autor(a): See file upload history for details.
Términos de Uso: Dominio Público
Licencia: Dominio Público
¿Se exige la atribución?: No
Usos del archivo
La siguiente página enlaza a este archivo:
