
Archivo: 2012dates

Tamaño de esta previsualización: 800 × 351 píxeles. Otras resoluciones: 320 × 140 píxeles | 1425 × 625 píxeles.
Archivo original (1425 × 625 píxeles; tamaño de archivo: 60 KB; tipo MIME: image/png)
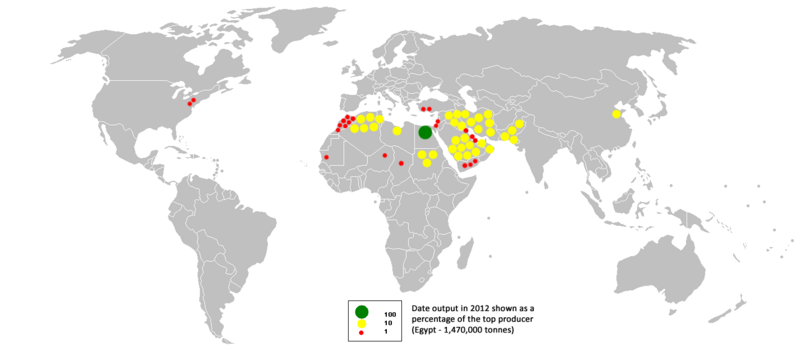
Description: This bubble map shows the global distribution of date output in 2012 as a percentage of the top producer (Egypt - 1,470,000 tonnes). This map is consistent with incomplete set of data too as long as the top producer is known. It resolves the accessibility issues faced by colour-coded maps that may not be properly rendered in old computer screens. Data was extracted on 24th February 2012 from FAO.
Title: 2012dates
Credit: Own work
Author: Swidran
Usage Terms: Creative Commons Attribution-Share Alike 4.0
License: CC BY-SA 4.0
License Link: http://creativecommons.org/licenses/by-sa/4.0
Attribution Required?: Yes
Usos del archivo
La siguiente página enlaza a este archivo:

Todo el contenido de los artículos de la Enciclopedia Kiddle (incluidas las imágenes) se puede utilizar libremente para fines personales y educativos bajo la licencia Atribución-CompartirIgual a menos que se indique lo contrario.