
Archivo: 2005oat

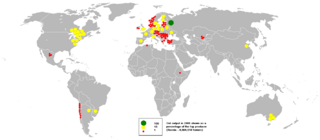
Descripción: This bubble map shows the global distribution of oat output in 2005 as a percentage of the top producer (Russia - 4,564,510 tonnes). This map is consistent with incomplete set of data too as long as the top producer is known. It resolves the accessibility issues faced by colour-coded maps that may not be properly rendered in old computer screens. Data was extracted on 9th June 2007 from http://faostat.fao.org/site/336/DesktopDefault.aspx?PageID=336 Based on :Image:BlankMap-World.png
Título: 2005oat
Créditos: Transferido desde en.wikipedia a Commons por Stefan4 usando CommonsHelper.
Autor(a): Anwar saadat de Wikipedia en inglés
Términos de Uso: Creative Commons Attribution-Share Alike 3.0
Licencia: CC BY-SA 3.0
Enlace de Licencia: https://creativecommons.org/licenses/by-sa/3.0
¿Se exige la atribución?: Sí
Usos del archivo
La siguiente página enlaza a este archivo:
