
Archivo: Timeline of daily COVID-19 vaccine doses administered in the US

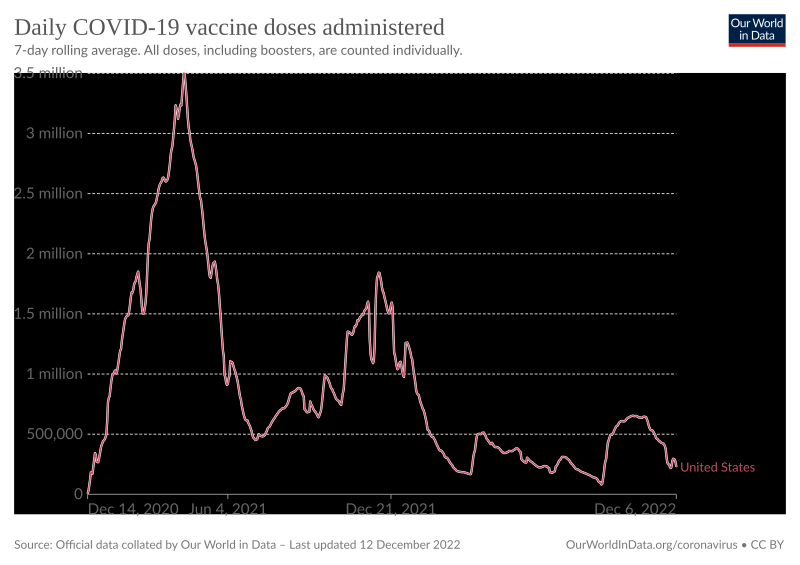
Descripción: Timeline of daily COVID-19 vaccine doses administered in the US. Rolling 7-day average. See the date on the right side of the timeline below the graph.
Título: Timeline of daily COVID-19 vaccine doses administered in the US
Créditos: https://ourworldindata.org/grapher/daily-covid-19-vaccination-doses?tab=chart&country=~USA Click on the download tab, and then the SVG link to get the SVG file. The table tab has a table of the data by date. The sources tab says the data is from the COVID-19 Data Repository by the Center for Systems Science and Engineering (CSSE) at Johns Hopkins University. The graph on the chart tab at the source is interactive and provides more detail. For example, run your cursor over the graph to see the date and the number vaccinated that day. The actual number may be higher or lower since a rolling 7-day average is used.
Autor(a): Our World In Data. See Our World in Data.
Términos de Uso: Creative Commons Attribution 4.0
Licencia: CC BY 4.0
Enlace de Licencia: https://creativecommons.org/licenses/by/4.0
¿Se exige la atribución?: Sí
Usos del archivo
La siguiente página enlaza a este archivo:
