
Archivo: Population Scaled US Map
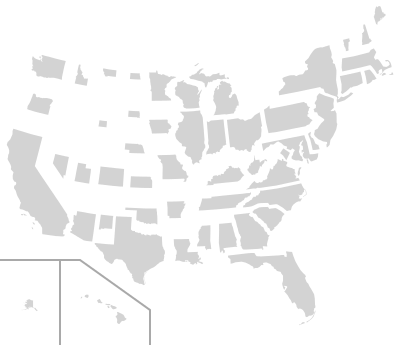
Descripción: This request originated from the Illustration workshop, and was solved mathematically using the data at the linked article. By definition, the population density is the population divided by area, or: dpop≡PA{\displaystyle d_{pop}\equiv {\frac {P}{A}}} or, equivalently, P=dpop⋅A{\displaystyle {P}=d_{pop}\cdot A}We want to resize each state according to its population, so each state's new area will be defined by a new (constant) population density, dpop,n{\displaystyle d_{pop,n}}: Anew=Pdpop,n{\displaystyle A_{new}={\frac {P}{d_{pop,n}}}}We can substitute for P{\displaystyle P} in the above expression to get: Anew=Pdpop,n=(dpop⋅A)dpop,n=A⋅(dpopdpop,n){\displaystyle A_{new}={\frac {P}{d_{pop,n}}}={\frac {\left(d_{pop}\cdot A\right)}{d_{pop,n}}}=A\cdot \left({\frac {d_{pop}}{d_{pop,n}}}\right)}This means the new area Anew{\displaystyle A_{new}} is simply the existing area A{\displaystyle A} multiplied by an areal scaling factor (dpopdpop,n){\displaystyle \left({\frac {d_{pop}}{d_{pop,n}}}\right)}. Since area is the product of two dimensions, we can apply an equal scaling factor in each dimension (which is what the SVG expects) by taking the square root of the areal scaling factor: Sx,y=dpopdpop,n{\displaystyle S_{x,y}={\sqrt {\frac {d_{pop}}{d_{pop,n}}}}}I took the new population density to be equal to the 2013 population density of New Jersey, 1,210.1 persons per square mile, which in essence normalizes the scaling factor to New Jersey. For instance, California has a 2013 population density of 246.1 persons per square mile, so: Sx,yCA=dpopdpop,n=246.11210.1=0.451{\displaystyle S_{x,y}^{CA}={\sqrt {\frac {d_{pop}}{d_{pop,n}}}}={\sqrt {\frac {246.1}{1210.1}}}=0.451} That means that I apply a scaling transformation factor of 0.451 to the California SVG object in each (x,y) dimension. When all is said and done, though, I had to end up translating most of the state SVG objects as well, so it ended up being a matrix transform (scaling + translation). When the population and/or land areas update, the updated data could be used to adjust the scaling factors in the SVG directly without having to go through a graphical editor.
Título: Population Scaled US Map
Créditos: Trabajo propio, using vector source linked below.
Autor(a): Mliu92
Términos de Uso: Creative Commons Attribution-Share Alike 4.0
Licencia: CC BY-SA 4.0
Enlace de Licencia: https://creativecommons.org/licenses/by-sa/4.0
¿Se exige la atribución?: Sí
Usos del archivo
La siguiente página enlaza a este archivo:
