
Archivo: Nuclear energy generation

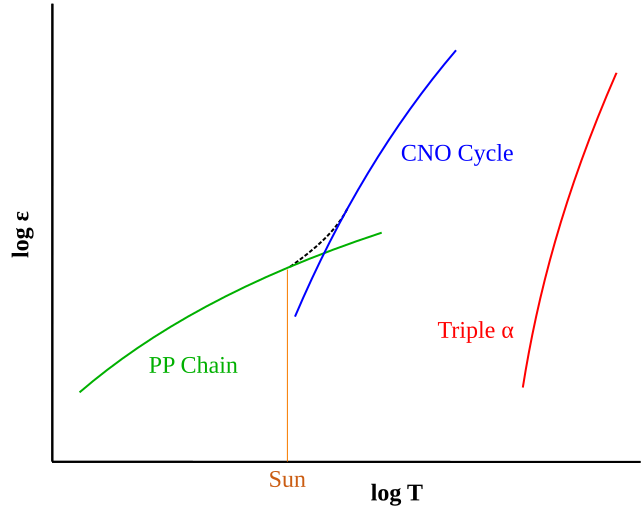
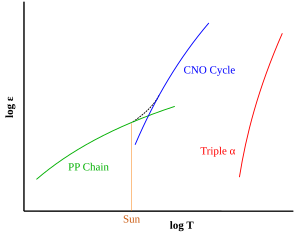
Descripción: This plot shows the rate of nuclear energy generation (ε) for a main sequence star as a function of temperature (T). The green curve shows the proton-proton cycle, blue is the CNO cycle and red is the triple-α process. The brown vertical line represents the core temperature of the Sun, demonstrating that the P-P chain is the primary source of energy generation. The dashed line joining the P-P curve to the CNO cycle represents the net energy generation rate of the combined nuclear hydrogen burning cycles. The slope of the curves shows the greater temperature sensitivity of the CNO cycle and triple-α process. It supports automatic language switch betwween en and any among de el fr it ja mk nl pt ru zh.
Título: Nuclear energy generation
Créditos: Trabajo propio. See reference below.
Autor(a): RJHall
Términos de Uso: Creative Commons Attribution-Share Alike 3.0
Licencia: CC BY-SA 3.0
Enlace de Licencia: https://creativecommons.org/licenses/by-sa/3.0
¿Se exige la atribución?: Sí
Usos del archivo
La siguiente página enlaza a este archivo:
