
Archivo: Moreno Sociogram 1st Grade
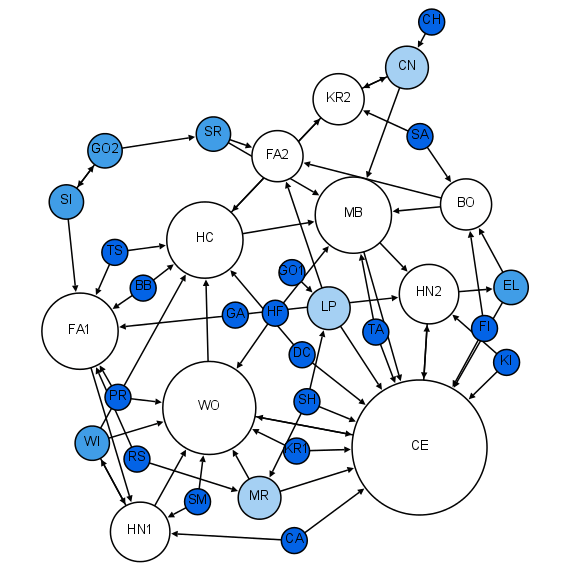
Descripción: Mapping the social affinities of a group of individuals, Moreno’s first sociograms visualize the relationships between pupils in a classroom: who wants to be sitting next to whom? Each child can choose two others, for results that suggest that sociabilities are changing over time: the proportion of attractions between boys and girls decrease, community structures are formed and then disappear, etc. Source: Grandjean, Martin (2015) Social network analysis and visualization: Moreno’s Sociograms revisited. Caption: Redesigned network strictly based on Moreno (1934), Who Shall Survive. Size and color of the nodes indicating the number of incoming connections ("in-degree" dark blue=0; white=3 and more).
Título: Moreno Sociogram 1st Grade
Créditos: Trabajo propio
Autor(a): Martin Grandjean
Términos de Uso: Creative Commons Attribution-Share Alike 4.0
Licencia: CC BY-SA 4.0
Enlace de Licencia: https://creativecommons.org/licenses/by-sa/4.0
¿Se exige la atribución?: Sí
Usos del archivo
La siguiente página enlaza a este archivo:
