
Archivo: Logic Gates

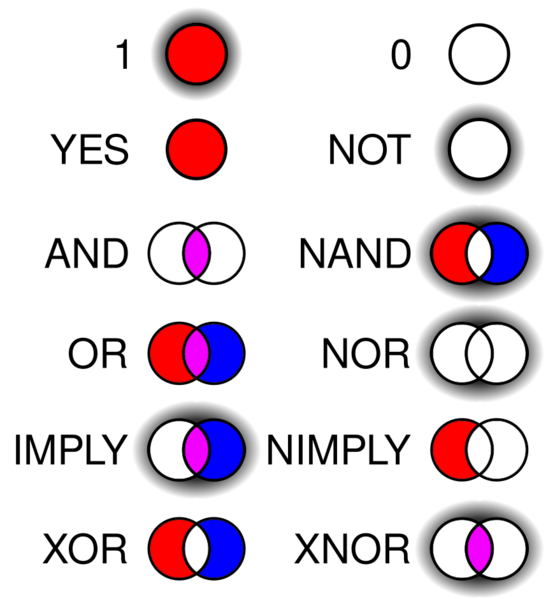
Descripción: VIsual diagram of various Logic gates. The parts of the diagram correspond to the four permutations possible given two boolean variables. The red and blue circles parts correspond to one variable being high (having a truth value of 1); the purple between them represents them both as high, and the gray shading behind the Venn Diagram represents two low (0) values. Each gate's diagram shows which permutation(s), if any, of those two variables that will produce a high when run through that gate.
Título: Logic Gates
Créditos: Trabajo propio
Autor(a): HereToHelp
Permiso: see template
Términos de Uso: Creative Commons Attribution-Share Alike 4.0
Licencia: CC BY-SA 4.0
Enlace de Licencia: https://creativecommons.org/licenses/by-sa/4.0
¿Se exige la atribución?: Sí
Usos del archivo
La siguiente página enlaza a este archivo:
