
Archivo: FTSE 100 index chart since 1984

Tamaño de esta previsualización: 800 × 466 píxeles. Otras resoluciones: 320 × 186 píxeles | 992 × 578 píxeles.
Archivo original (992 × 578 píxeles; tamaño de archivo: 23 KB; tipo MIME: image/png)
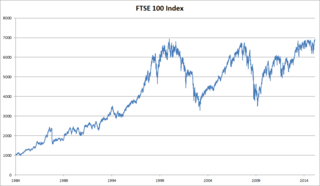
Description: Chart of the highs and lows of the FTSE 100 Index. It is different from the existing FTSE 100 Index.png because that one has misleading axes and data back further in the past, apparently before the FTSE 100 existed. Other information Chart by OpenOffice, Image by Gimp
Title: FTSE 100 index chart since 1984
Credit: Data is from Yahoo! Finance
Author: Thrapper
Usage Terms: Creative Commons Attribution-Share Alike 3.0
License: CC BY-SA 3.0
License Link: http://creativecommons.org/licenses/by-sa/3.0
Attribution Required?: Yes
Usos del archivo
La siguiente página enlaza a este archivo:

Todo el contenido de los artículos de la Enciclopedia Kiddle (incluidas las imágenes) se puede utilizar libremente para fines personales y educativos bajo la licencia Atribución-CompartirIgual a menos que se indique lo contrario.