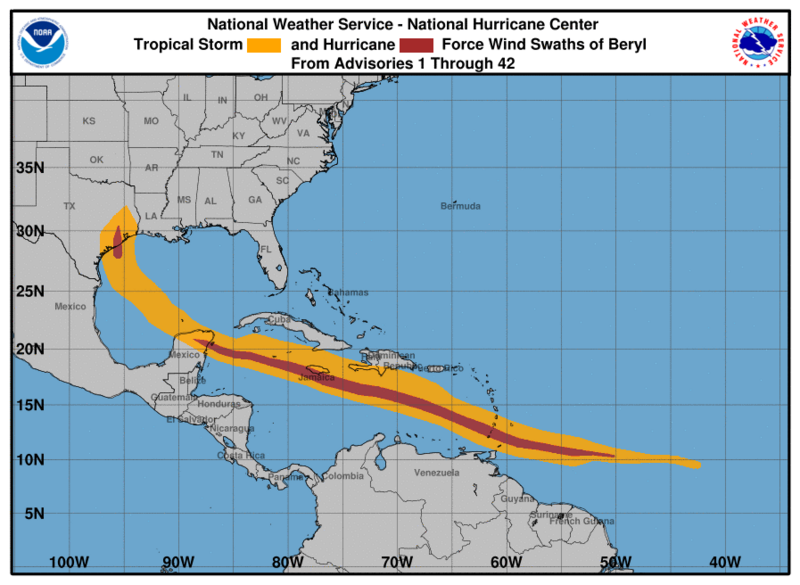
Archivo: Beryl 2024 wind history

Tamaño de esta previsualización: 800 × 585 píxeles. Otras resoluciones: 320 × 234 píxeles | 897 × 656 píxeles.
Archivo original (897 × 656 píxeles; tamaño de archivo: 63 KB; tipo MIME: image/png)
Descripción: This graphic shows how the size of the storm has changed, and the areas potentially affected by sustained winds of tropical storm force (in orange) and hurricane force (in red). The display is based on the wind radii contained in the set of Forecast/Advisories indicated at the top of the figure. Users are reminded that the Forecast/Advisory wind radii represent the maximum possible extent of a given wind speed within particular quadrants around the tropical cyclone. As a result, not all locations falling within the orange or red swaths will have experienced sustained tropical storm or hurricane force winds, respectively.
Términos de Uso: Dominio Público
Usos del archivo
La siguiente página enlaza a este archivo:

Todo el contenido de los artículos de la Enciclopedia Kiddle (incluidas las imágenes) se puede utilizar libremente para fines personales y educativos bajo la licencia Atribución-CompartirIgual a menos que se indique lo contrario.
