
Archivo: Atmospheric CO2 with glaciers cycles

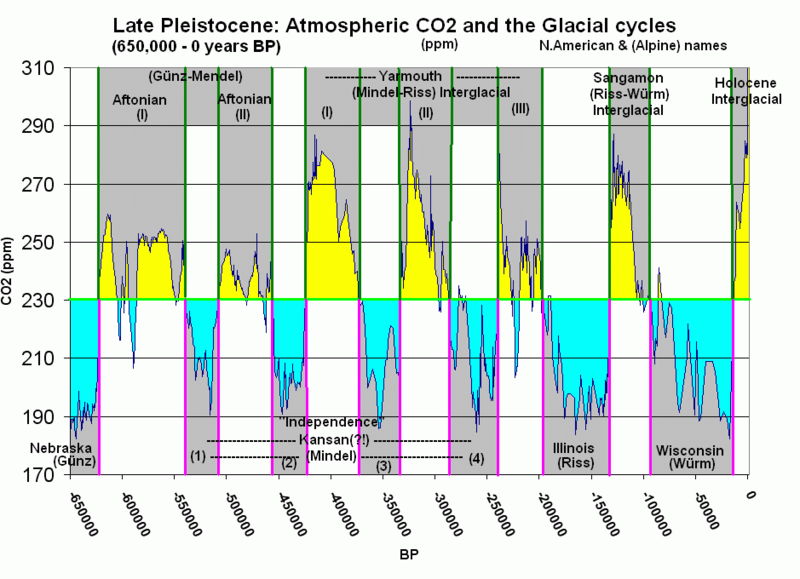
Descripción: Ice Core data for Atmospheric CO2 related to the glacial cycles This graph shows the newest Ice Core data for Atmospheric CO2 from air bubbles in the ice. I tried to connect it to the glacial cycles by marking 230 ppm as a transition level and colored "glacial periods" blue and interglacial periods yellow. There's a clear 80,000-110,000 period of repeating glacier even if they vary in quality. Human deforestation and burning of fossil fuel has raised atmospheric CO2 to over 380 ppm in the last century, well above pre-industrialized levels, and "off the scale" of this graph top.
Título: Atmospheric CO2 with glaciers cycles
Créditos: Source data: (Combined) Law Dome: 1006 A.D.-1978 A.D http://cdiac.esd.ornl.gov/ftp/trends/co2/lawdome.combined.dat Vostok ice core: 417,160 - 2,342 years BP http://cdiac.esd.ornl.gov/trends/co2/vostok.html Dome C ice core: 650,000 - 415,000 BP-(or 648th millennium BC to 413th millennium BC) ftp://ftp.ncdc.noaa.gov/pub/data/paleo/icecore/antarctica/epica_domec/edc-co2-650k-390k.xls
Autor(a): Tom Ruen en:User:Tomruen
Permiso: PD-self
Términos de Uso: Dominio Público
Licencia: Dominio Público
¿Se exige la atribución?: No
Usos del archivo
La siguiente página enlaza a este archivo:
