
Archivo: 2009 Pacific typhoon season summary
Tamaño de esta previsualización: 800 × 600 píxeles. Otras resoluciones: 320 × 240 píxeles | 4000 × 3000 píxeles.
Archivo original (4000 × 3000 píxeles; tamaño de archivo: 7,66 MB; tipo MIME: image/png)
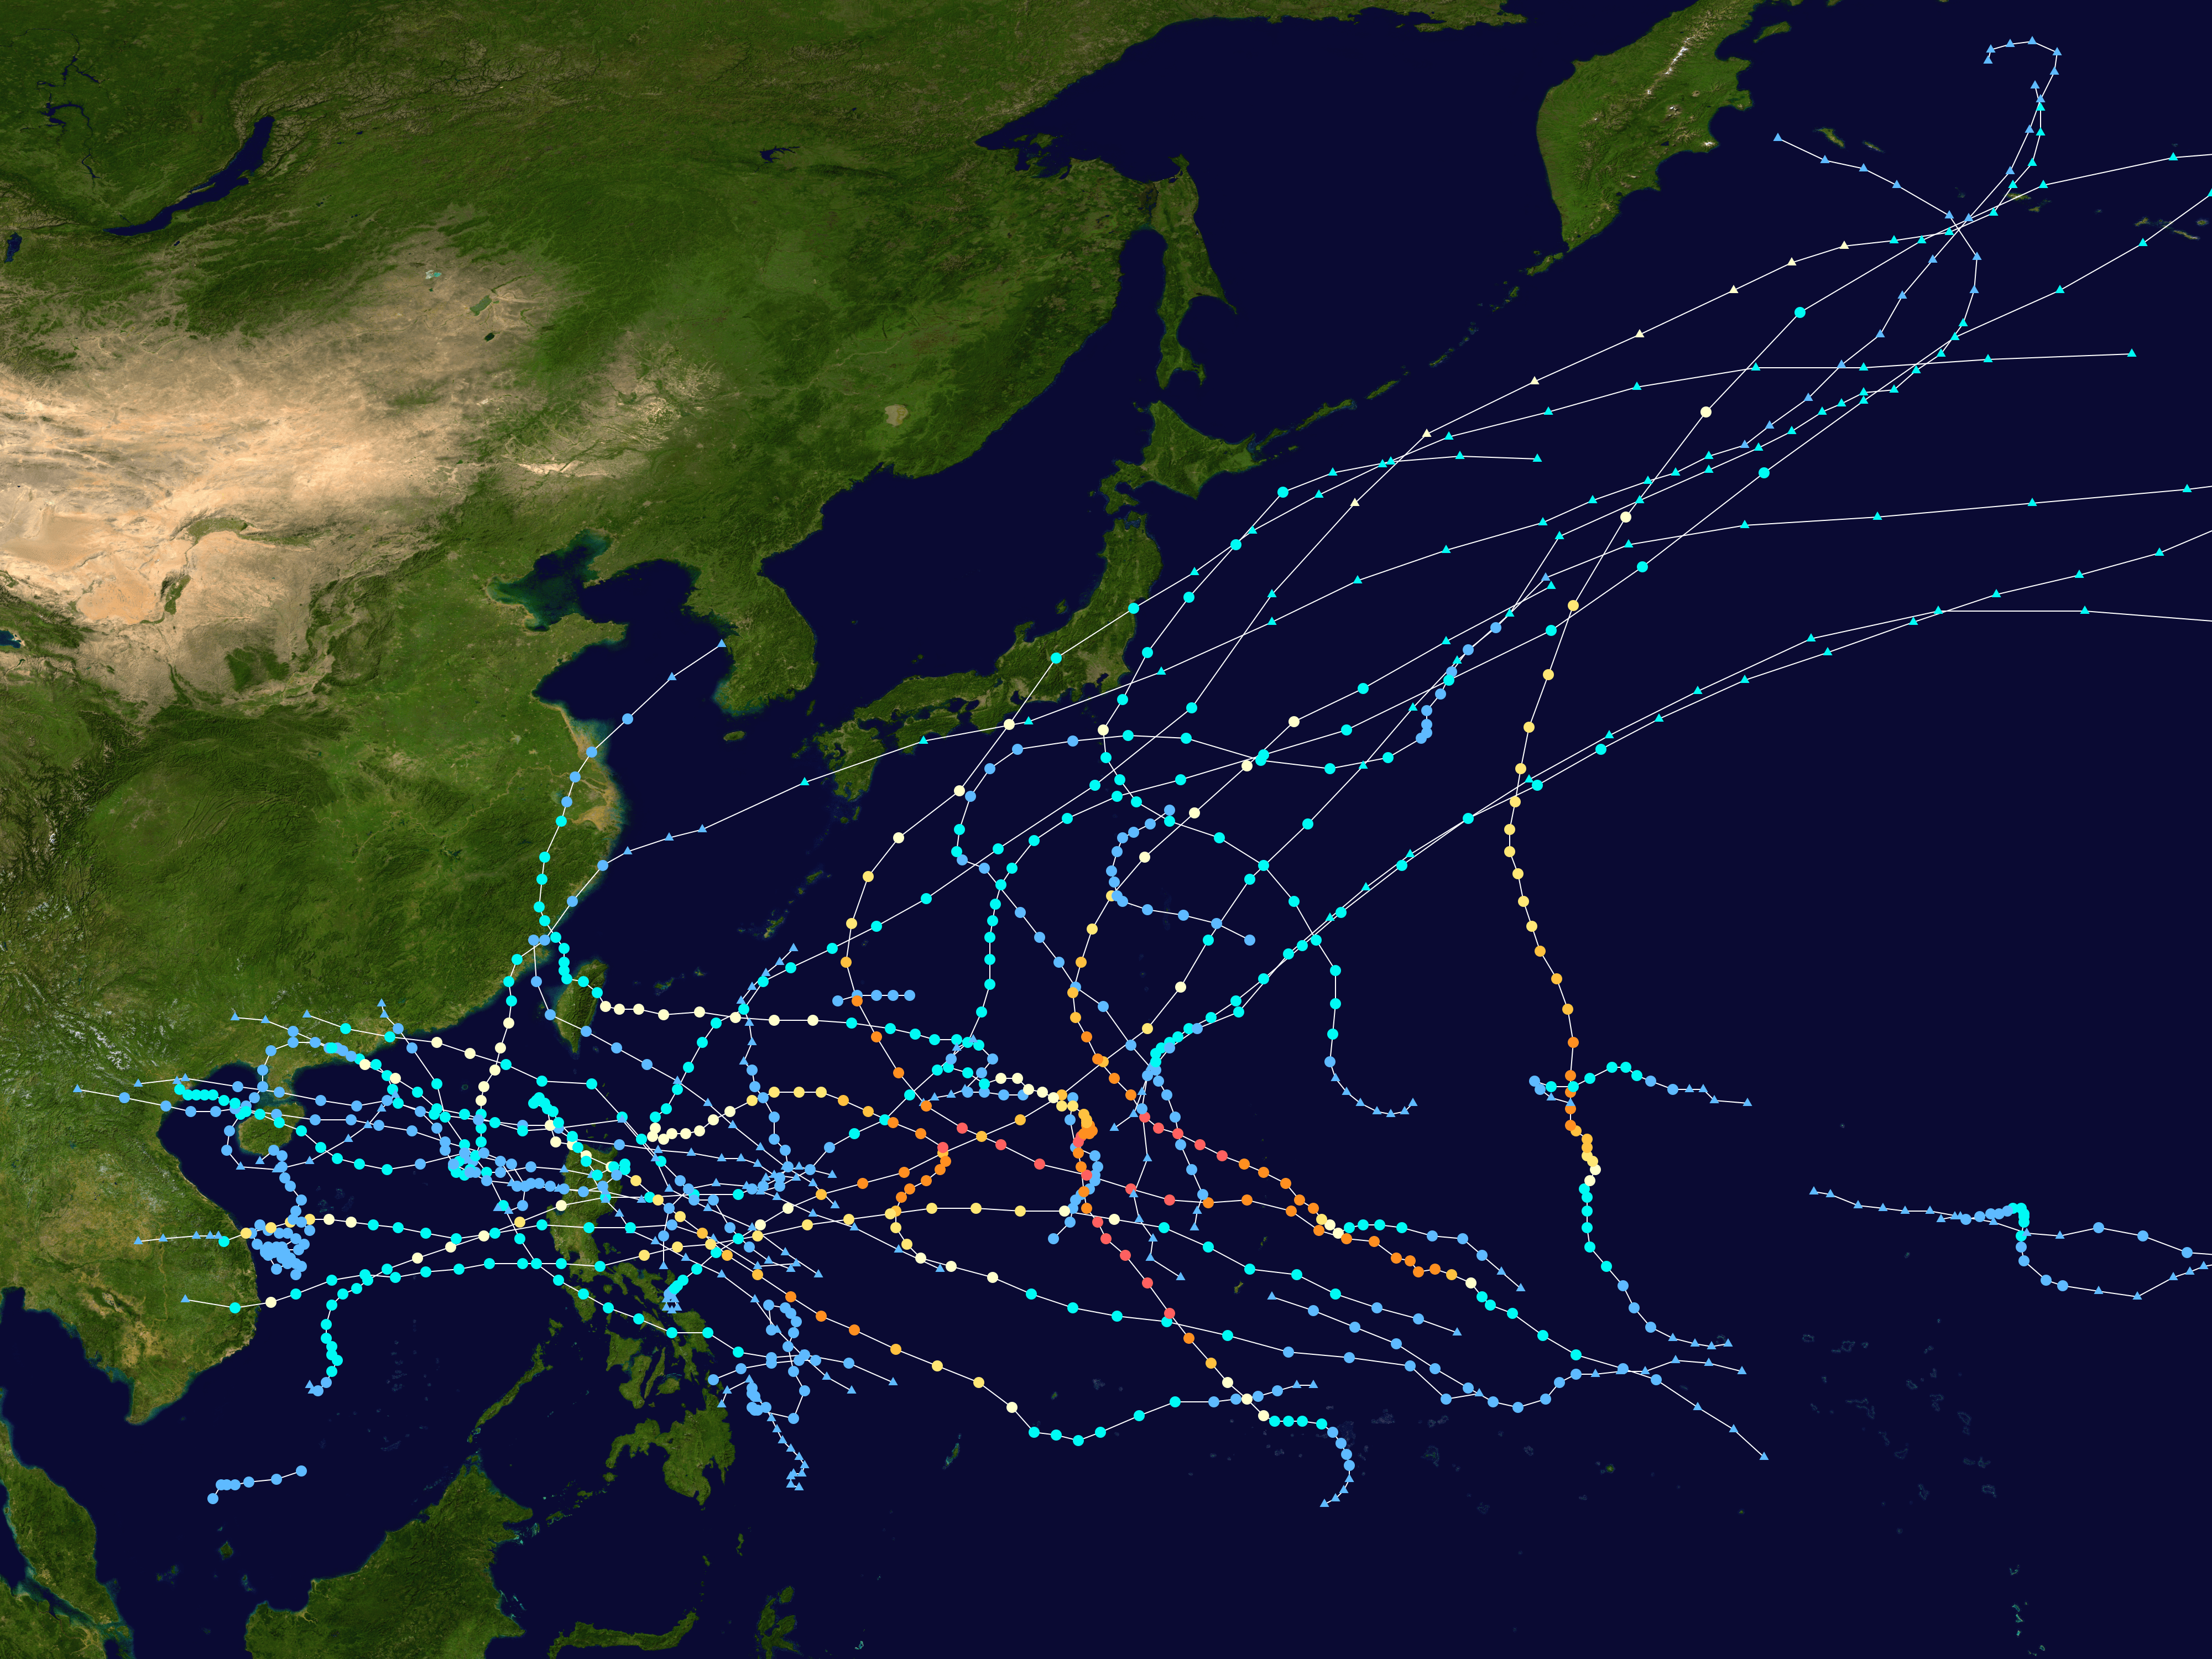
Description: This map shows the tracks of all tropical cyclones in the 2009 Pacific typhoon season. The points show the location of each storm at 6-hour intervals. The colour represents the storm's maximum sustained wind speeds as classified in the Saffir-Simpson Hurricane Scale (see below), and the shape of the data points represent the type of the storm.
Title: 2009 Pacific typhoon season summary
Credit: Created using WikiProject Tropical cyclones/Tracks. The background image is from NASA [1]. The tracking data is from the Joint Typhoon Warning Center's best track database
Author: Cyclonebiskit
Usage Terms: Public domain
License: Public domain
Attribution Required?: No
Usos del archivo
La siguiente página enlaza a este archivo:

Todo el contenido de los artículos de la Enciclopedia Kiddle (incluidas las imágenes) se puede utilizar libremente para fines personales y educativos bajo la licencia Atribución-CompartirIgual a menos que se indique lo contrario.